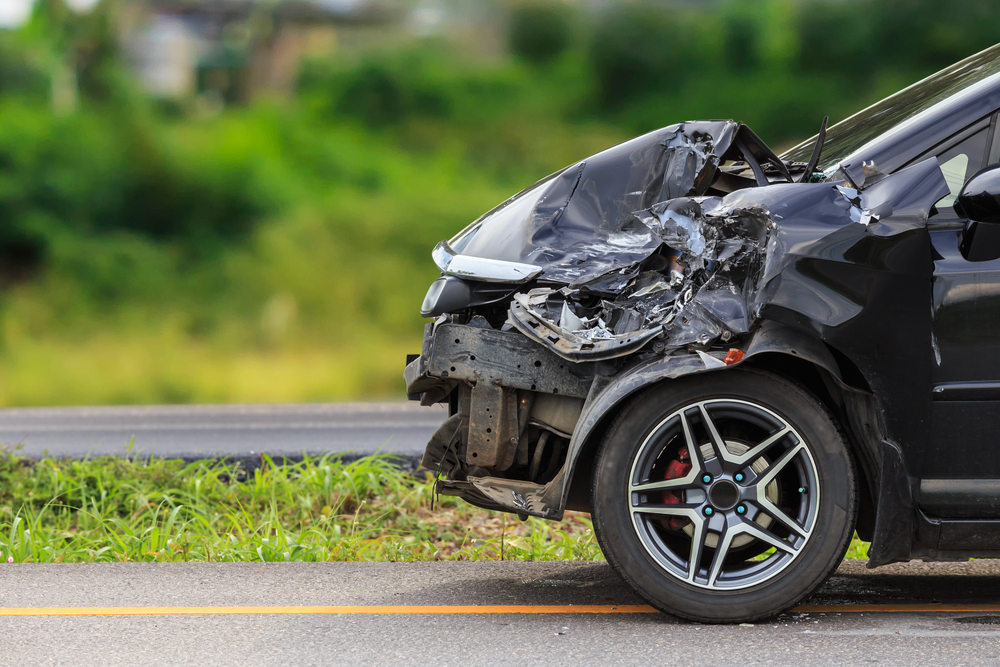
Understanding the risks associated with daily activities, such as driving, is key to making informed decisions about your safety. The odds of dying in a car crash are a statistic that can seem intimidating, but it’s important to evaluate this risk within the broader context of road safety and personal behavior. Every time you get behind the wheel, a set of variables—ranging from your driving habits to the safety features of your vehicle—play a critical role in determining the likelihood of being involved in a fatal accident.
Traffic accidents are among the leading causes of death worldwide, but the likelihood of dying in a car crash varies significantly depending on numerous factors. These include geographic location, the condition of road infrastructure, the enforcement of traffic laws, and advancements in automotive safety technology. You are part of this equation as well, with your driving experience, attention to the road, and adherence to safety precautions directly affecting your risk.
Current data and analyses provide valuable insights into the patterns and causes of vehicular fatalities. This information is crucial for both policymakers aiming to improve road safety and for you as a driver or passenger, helping to inform safe driving practices. While some aspects of driving are beyond your control, such as the behavior of other drivers or sudden mechanical failures, understanding the statistics can help you make choices that minimize your risk of becoming part of these sobering statistics.
Statistical Overview of Vehicle Fatality Risks
Understanding the risks of vehicle fatalities is crucial for making informed decisions on the road. This section provides a data-driven perspective on the subject.
Odds of Dying in a Car Crash by Geography
In the United States, your odds of dying in a car crash can vary significantly depending on the state or region. For example:
- Nevada: As per recent statistics, Nevada has a rate of 1.25 fatalities per 100 million vehicle miles traveled (VMT).
To give you a clearer picture, below is a breakdown of the odds in a tabular format, taking into account different geographic locations:
| Location | Fatalities per 100M VMT |
| Nevada | 1.25 |
| National Average | 1.10 |
Driving conditions, traffic laws, population density, and road quality contribute to these geographic discrepancies.
Comparison with Other Forms of Transportation
Your risk of dying in a transportation-related accident is not limited to cars; it extends to all forms of transportation. Here is a comparison:
- By Air: Commercial airlines boast a remarkably low fatality rate, with a statistical chance of about 0.07 fatalities per billion passenger miles.
- By Rail: Train travel is also safer, with a 0.15 fatality rate per billion passenger miles.
The contrast is stark when you look at the numbers side by side:
- By Car: The odds increase significantly, with an approximate fatality rate of 7.28 per billion passenger miles.
Your risk of dying in a car crash is greater than in air or rail travel; understanding these statistics plays a key role in transportation safety awareness.
Factors Influencing Car Crash Fatalities
Several distinct elements can affect the likelihood and severity of your involvement in a fatal car crash. These range from the design of your vehicle to the decisions you make while driving, as well as external conditions such as weather and road quality.
Role of Vehicle Safety Features
Your vehicle’s safety features play a critical role in protecting you during a crash. Modern cars come with a multitude of safety systems designed to reduce fatalities:
- Airbags: Frontal and side-impact airbags are designed to deploy in milliseconds upon collision, cushioning you from severe impacts.
- Anti-lock Braking System (ABS): It prevents wheel lock-up during braking, allowing you to maintain steering control.
- Electronic Stability Control (ESC): This feature helps to prevent skids and loss of control in slippery conditions.
- Crumple Zones: These areas of your vehicle are designed to deform and crumple in a collision, absorbing the energy of the impact.
- Seat Belts: Wearing your seat belt can significantly reduce your risk of fatal injury.
Impact of Driving Behavior
Your behavior behind the wheel is a significant factor in the risk of a fatal accident:
- Speeding: Exceeding speed limits increases both the likelihood of accidents and the severity of crash outcomes.
- Driving Under the Influence: Consumption of alcohol or drugs impairs your reaction times and decision-making abilities.
- Distracted Driving: Activities like texting, eating, or using in-car systems can divert your attention from the road.
Driving defensively and adhering to traffic laws is essential for your safety and the safety of others.
Effects of Weather and Road Conditions
Weather and road conditions in Nevada, or any other location, can seriously impact driving safety:
- Wet Roads: Slippery surfaces reduce tire traction, increasing stopping distances and the potential for hydroplaning.
- Visibility: Fog, heavy rain, or snow can drastically reduce visibility, requiring you to adjust your speed and following distance.
- Road Maintenance: Well-maintained roads have fewer hazards like potholes that can cause accidents or vehicle damage.
Staying vigilant about forecasts and adjusting your driving to match conditions are critical preventive measures you can take.
If you are looking for legal advice and awareness on Las Vegas Personal Injury Lawyer or Las Vegas Car Accident Lawyer click here to contact us.
